Market sparklines through a URL
Embed sparklines of stock, crypto, indices and more in HTML, markdown, and anywhere else images work.
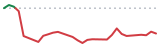
https://ticker-line.com/v1/sparkline?ticker=AAPL&market=stock&timeframe=1mTry it yourself
Choose an example or enter a supported market symbol.
Usage
HTML
<img
  src="https://ticker-line.com/v1/sparkline?ticker=AAPL&market=stock&timeframe=1m"
  alt="AAPL price over one month"
  width="160"
  height="48"
/>Markdown
Request
| Name | Default | Description |
|---|---|---|
tickerrequired | — | Use a supported market symbol. |
marketrequired | — | stock, crypto, forex, commodity, or index. |
timeframeoptional | 1m | 1d, 7d, 1m, 3m, 1y, or 5y. |
themeoptional | light | light or dark. |
filloptional | false | Fill gains and losses to the chart reference line. |
formatoptional | svg | svg for embeds; json for quote data and semantic errors. |
Response
Set format=json to return quote data and the rendered SVG in JSON. Leaving the format option out returns an embeddable SVG.
{
  "ticker": "AAPL",
  "market": "stock",
  "timeframe": "1m",
  "price": 314.98,
  "referencePrice": 296.34,
  "change": 18.64,
  "changePercent": 6.29,
  "direction": "up",
  "dataAsOf": "2026-07-10T00:00:00.000Z",
  "svg": "<svg ...>...</svg>"
}
price is the latest close. Change values compare it with referencePrice; changePercent is expressed in percentage points.
Errors
SVG requests stay embeddable: failures return HTTP 200 with a gray fallback image and error details in headers. JSON requests use semantic status codes.
X-Error-Code: TICKER_NOT_FOUND
X-Error-Status: 404INVALID_REQUESTTICKER_NOT_FOUNDINSUFFICIENT_DATARATE_LIMITEDPROVIDER_ERRORSERVICE_UNAVAILABLEFreshness
Cache duration depends on timeframe, asset type, and market session. Freshness ranges from 25 minutes for one-day charts to five days for five-year charts. Inspect X-Data-As-Of or JSON dataAsOf for the source timestamp.
During a provider outage, a recent cached chart may be served within a bounded stale window. No real-time guarantee is implied.
Data Providers
Market data is sourced from SiftingIO, with London Strategic Edge providing secondary fallback coverage.
FAQ
Is Ticker Line free to use?
Yes. Ticker Line is free to call without an API key. Requests are rate-limited per IP under the fair-use terms, so cache responses and avoid needless polling.
Which markets does Ticker Line support?
Use the required market parameter to request stock, crypto, forex, commodity, or index data. Symbols must be supported by the configured market-data providers.
How fresh is the market data?
Freshness depends on the timeframe, asset type, and market session. One-day charts are normally fresh for 25 minutes; five-year charts can be fresh for up to five days. Inspect X-Data-As-Of or dataAsOf for the source timestamp.
Can I use a sparkline in Markdown or a GitHub README?
Yes. Use the sparkline URL as an image source in HTML or Markdown. The default SVG response is designed to remain embeddable.
How do I get quote data as JSON?
Add format=json to the sparkline URL. The JSON response includes quote metrics, the data timestamp, and the rendered SVG.
Terms
Free to call without an API key. Cache responses and avoid needless polling. Fair use applies: requests are rate-limited per IP to protect the shared service. Charts may be delayed or contain errors and are not financial advice.